In our previous post, we showed how to use FullPageOS and RevealJS to display a page. The presentation that we created was a static presentation. However, one of the benefits of Reveal.js is that you can use JavaScript to create dynamic presentations. In this example, we will source the content from a REST API. For a refresher on REST, check out this post. The full code for this presentation is available on our GitHub.
REST Easy and Get the Data
The first thing that we need is the content. For this example, we will use the Bloons TD 6 API. Bloons TD 6 is a fun tower defense game available on multiple platforms. Any API would work for this. I used Bloons TD 6 because the data is interesting, and the API is publicly available. In addition, the API doesn’t require a key, which is nice because that creates security problems in JavaScript.
Fetch, Data, Fetch!
In JavaScript, we will use Fetch to send a request to the API and to receive a response from the API. Fetch takes two parameters: the URL and options. In our case, we will only use the URL.
Fetch returns a Promise. In JavaScript, a Promise is an object that will eventually contain a result. A promise starts with a status of pending and changes to either fulfilled or rejected once the request is completed. We can’t do anything with the Promise until it changes status from “pending” to “fulfilled” (or “rejected”).
In our example, we start by getting a list of the most liked maps in Bloons. The endpoint for this API call is: https://data.ninjakiwi.com/btd6/maps/filter/mostLiked.
const apiUrl = "https://data.ninjakiwi.com/btd6/maps/filter/mostLiked";
fetch(url)
Fulfilling a Promise: The Callback
We use then() to say that once the promise is no longer pending, you should do something. then() takes two parameters (we will only use the first), a callback function that is called once the result is fulfilled.
We could use a normal JavaScript function. However, we are going to use a more compact function form called Arrow functions (lambdas in other programming languages like Python).
The basic format of an Arrow function is:
parameter => expressionor, for multiple statements:
parameter => {
    expressions
}
In our case, we will actually string multiple arrow strings and functions together. Our first then() is:
.then(response => response.json())This Arrow function simply takes the response and parses it as JSON. json() returns another promise, so we need another then(). Our next then() which will process and pull out the data that we want.
.then(data => {
   for (let index=0; (index<data.body.length) && (index<5); index++){
      mapString = mapString.concat("<td>", data.body[index].name, "</td>");
   }

   mapString = mapString.concat("</tr><tr>");

   for (let index=0; (index<data.body.length) && (index<5); index++){
      mapString = mapString.concat("<td id=mapThumbnail",index,"></td>");
      getMapInfo(data.body[index].metadata, index);
   }
});
We loop through up to the first five entries in data.body. From each entry we take the name data.body[index].name, and we insert into a table cell appending that to our HTML code that we will eventually insert into our page.
for (let index=0; (index<data.body.length) && (index<5); index++){
   mapString = mapString.concat("<td>", data.body[index].name, "</td>");
}
Paint Me a Picture
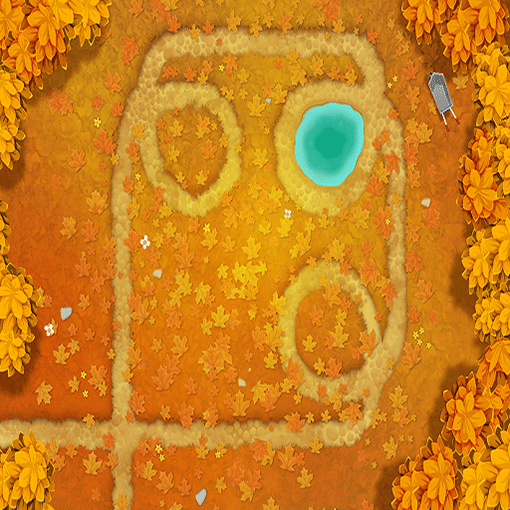
Next, we loop through the same five entries and retrieve the thumbnail calling our function getMapInfo, which takes a URL for the map metadata. The getMapInfo function follows a similar pattern: fetch->then parse as JSON->then pull out the thumbnail image URL.
     function getMapThumbnail(url, currentNumber){
				fetch(url)
					.then(response => response.json())
					.then(data => {
						mapImage = data.body.mapURL;
						mapURL = "<img src=\"".concat(mapImage,"\">");

						document.getElementById("mapThumbnail".concat(currentNumber)).innerHTML = mapURL;
					});
			}
Inserting into the presentation
Once we have pulled the data from the API, we now need to insert it into the HTML. We use the Document interface to insert the string into the HTML for the page.
document.getElementById("mapList").innerHTML = mapString;This code looks for the ID mapList and inserts our string. Here is the corresponding HTML:
<table style="width:90%" id="mapList"></table>You can think of the innerHTML as inserting something between the start and end tags.
<table id="mapList">INNER HTML GOES HERE.</table>Creating Dynamic Charts
The previous section showed how to insert text and images into the RevealJS presentation. In addition, we can also create charts. We will use chart.js to create the chart.
For this example, we will use Bloons Race and Boss data. From the API, we can pull the number of times that a Race or Boss was completed. We will create a bar chart that shows the different races or bosses and the number of completions for each.
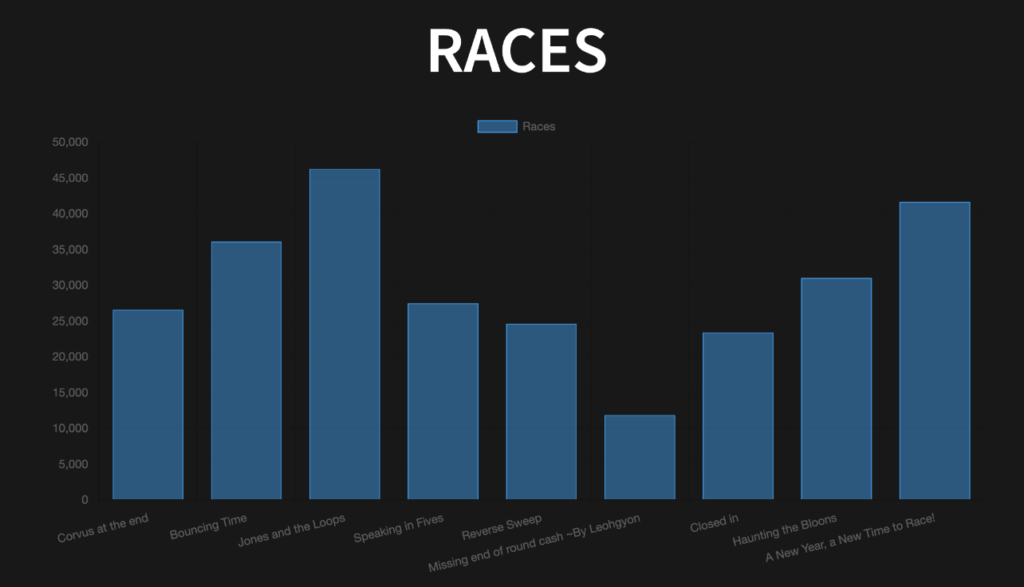
Creating the Chart
We created a function called createChart that handles creating the chart. It takes four parameters: the data, the labels for the data, the name of the data series, and the element ID where we want the chart.
      function showChart(data,names, data_label, elementID){
				const ctx = document.getElementById(elementID);
				const chartID = new Chart(ctx, {
					type: 'bar',
					data: {
					labels: names,
					datasets: [{
						label: data_label,
						data: data,
						borderWidth: 1
					}]
					},
					options: {
					scales: {
						y: {
						beginAtZero: true
						}
					}
					}
				});
			}
First, we get the context (the element) where we want to place the chart.
const ctx = document.getElementById(elementID);For Chart.js, this must be a canvas element.
<canvas id="raceChart" style="width:100%;"></canvas>Next, we create the chart. We provide a few parameters:
- The context (or element) where the chart will be placed
- The type of chart (in our case a bar chart)
- The Data
- The Labels (names of races)
- The Data (completions per race
There are many additional options that you can set for the chart. We only use borderWidth and beginAtZero.
Conclusion
This post has demonstrated how to create a dynamic presentation using RevealJS and JavaScript by fetching data from a REST API. We used the Bloons TD 6 API as an example, but this approach can be applied to any API that provides relevant data. We’ve shown how to:
- Fetch data from a REST API: We used the fetch API to retrieve data from the Bloons TD 6 API.
- Process and format the data: We parsed the JSON response and extracted the desired information.
- Inject data into the presentation: We dynamically added the retrieved data (map names, thumbnails, and chart data) to the HTML content of the presentation.
- Create charts: We used Chart.js to create a bar chart visualizing the completion data for races and bosses.
By combining RevealJS with JavaScript and APIs, you can create interactive and engaging presentations that update with real-time data, adding a new level of dynamism to your content.