I really enjoy using the Python REPL (Read-Eval-Print-Loop). It is an easy and fun way to test Python code. Frequently, I will have the REPL open alongside the Python code file that I am editing. However, with more complicated code, I struggled to be able to find bugs while using the REPL. In particular, I was working on a project that involved depth search of a graph. To implement the depth search, I used recursion. However, the output of the recursive function was not correct. I initially attempted to work through the REPL, typing each line into the REPL and examining the output. However, this is very time consuming since the graph could have thousands of nodes. In this post, I will walk through how to use the Python Debugger (pdb) in the REPL.
The code we will use as an example for debugging is extremely simple. For simplicity, it is only a loop, not a recursive function. We save this in debug.py.
def func():
  test = 0

  for index in range(100):
    test += 1

return testWhat is the Python Debugger?
The Python Debugger (pdb) is an interactive debugger. It is a standard module that is available in any implementation of Python and can be imported with:
import pdb
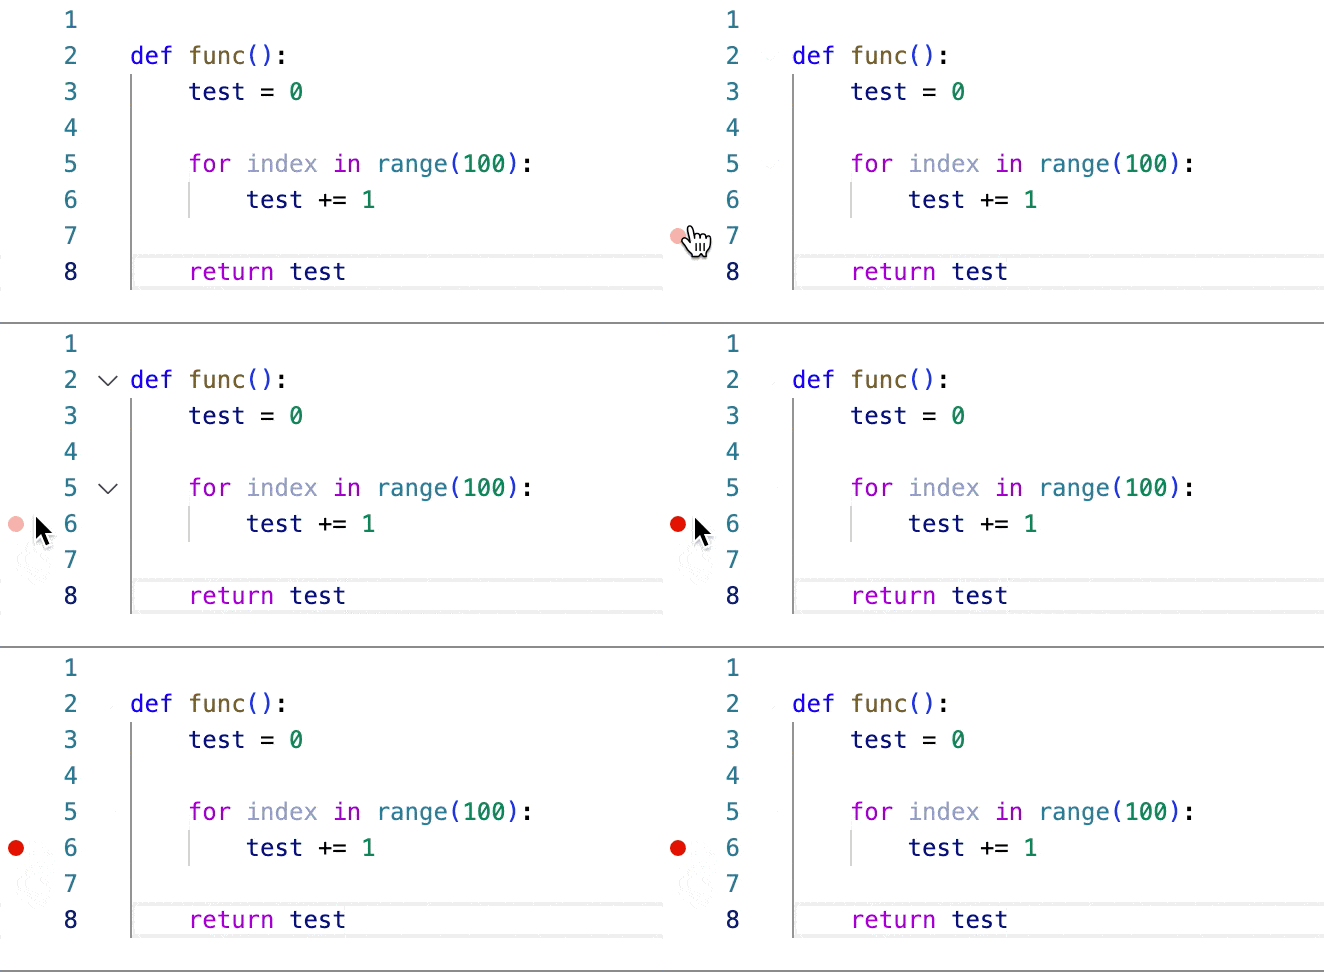
As an alternative, obviously you can debug in an IDE. For example, I primarily use Visual Studio Code to write Python code. I can easily debug by adding a breakpoint (click to add a red dot next to the line of code that I want to stop on) and clicking on Debug Python File.

However, sometimes, you may want to debug in the REPL. This allows you more flexibility as you can easily test various inputs quickly.
How do you use the debugger?
Using the debugger is easy. There are two approaches. First, you can add:
breakpoint()Wherever you want to stop in the code. Before Python 3.7, you would use:
pdb.set_trace()Alternatively, in the REPL (assuming you named your file debug.py), you can type:
import pdb
import debug

pdb.run(‘debug.func()’)
This will take you into the interactive debugger. Now you can use the following to step through the code:
- c (ontinue): continue executing the code to the next breakpoint
- n (ext): execute the next line of code, doesn’t go into functions
- s (tep): execute the next line of code, stepping into function
- unt (il) [line number]: execute until
- l (ist): show code around the current line of code
Conclusion
This post shows how to use the Python Debugger (pdb) in the Python REPL. There is certainly more advanced uses of pdb. However, for my purposes (and I would think for most purposes, this is sufficient). For a deeper dive, see this post. Also, here is a simple cheat sheet. Finally, since pdb is standard module, you can check out the implementation code here. Let me know in the comments below if there are any other debug functions you use or that you need to know more about.


One Comment